PortGuardian Case Study

PortGuardian application icon

PortGuardian Enterprise SIEM Edition

PortGuardian is a Windows endpoint agent tested in a VMware-based small-enterprise lab. It detects USB insertions, scans suspicious files locally with six checks, isolates the host on critical hits, and forwards only WARN and CRITICAL alerts to Splunk.

VMware virtual lab: 2 Windows 10 client VMs, 1 Windows Server 2019 Splunk VM at 192.168.1.50, 1 managed switch, 1 router/firewall, and a shared 192.168.1.0/24 VLAN.

Short Summary

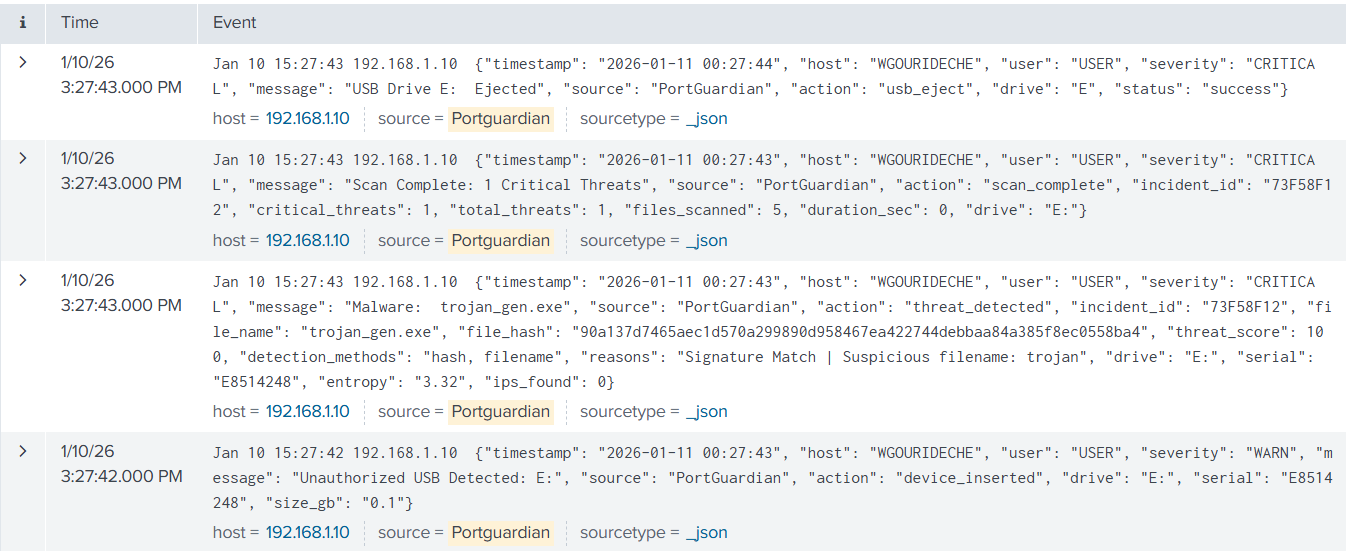
PortGuardian follows a local-first response model. WMI detects new USB media, a six-layer engine scores the files, and the endpoint reacts before Splunk is involved. Only the alerts that need analyst attention are sent to the SIEM.

  • Average USB detection time measured 350 ms in lab tests.
  • The VMware lab uses 2 Windows 10 client VMs and 1 Windows Server 2019 Splunk VM.
  • Only WARN and CRITICAL events go to 192.168.1.50 over Syslog UDP 514.
  • Scores of 85 or more eject the USB device and isolate the endpoint in under 5 seconds.

Actual Lab Topology

PortGuardian Enterprise Case Study | Walid Gourideche Inside a VMware-based virtual lab, two Windows 10 client VMs running the PortGuardian agent send WARN and CRITICAL JSON syslog events over UDP 514 inside VLAN 192.168.1.0/24 to a Windows Server 2019 Splunk VM at 192.168.1.50. PortGuardian High-Level Topology VMware Virtual Lab Host-to-Server Architecture Windows 10 Client VMs PortGuardian Agent x2 · 192.168.1.x USB Detection WMI event path avg. 350 ms Local Threat Scoring Six checks score local files Automated Mitigation USB eject + network isolation Syslog (RFC 5424) UDP 514 · JSON security alerts WARN / CRITICAL Windows Server 2019 VM Splunk Enterprise 9.x · 192.168.1.50 Central Event Intake Listens on 192.168.1.50:514 Parsing and Indexing Structured alerts become searchable SOC Visibility Dashboards, alerting and review The report publishes the fixed server IP and shared subnet, so the client VMs are shown as 192.168.1.x.

This diagram shows the main path in the VMware lab: two Windows 10 client VMs send WARN and CRITICAL syslog events over the shared 192.168.1.0/24 subnet to the Splunk VM at 192.168.1.50.

Simple Schemas

PortGuardian Enterprise Case Study | Walid Gourideche The first PortGuardian schema shows the six local detection layers that feed the final threat score. Schema 01 Six-Layer Forensic Engine Suspicious File Scan starts 1. Hash Signatures SHA-256 blacklist 3. Shannon Entropy Packed file > 7.2 5. PE Imports Suspicious APIs 2. Name Heuristics Suspicious keywords 4. Ext. Mismatch Magic bytes vs ext 6. IOC Extraction IPs and URLs Threat Score Cumulative 0-100 The six layers work together and build one additive threat score. If one method misses a file, another layer can still raise the score and trigger the response path.

The first schema zooms into the local scan and shows the six detection layers that build the final threat score.

PortGuardian Enterprise Case Study | Walid Gourideche Three follow-up PortGuardian schemas: the USB detection path, the critical response path, and the Splunk forwarding path. Schema 02 USB Detection Path USB Insert Physical trigger Win32_VolumeEvent WMI event Metadata Check Serial + signature Local Scan Six-layer engine Threat Score Score 0-100 USB insertion is detected locally through WMI. Known devices stay in the local log, while suspicious media moves to the scan and scoring stages. Schema 03 Critical Response Score ≥ 85 Critical threshold Eject USB mountvol + diskpart Block Firewall Windows Firewall deny Disable Adapters NIC shutdown Isolate Endpoint Host contained If the score reaches 85 or more, the client ejects the device and isolates the host without waiting for manual action. Schema 04 Splunk Forwarding WARN / CRITICAL Security filter JSON Event Structured payload UDP 514 RFC 5424 syslog 192.168.1.50 Central SIEM host Splunk Dashboard SOC visibility Only the important security events leave the endpoint. That keeps Splunk focused on the incidents that matter.

These next three schemas show the core operating path from the report: USB detection, automatic response, and filtered forwarding to Splunk.

Proof and Validation

350 ms

From USB insertion to detection in the lab.

< 5 s

From USB event to endpoint isolation.

99.8%

998 of 1,000 test alerts were received in Splunk.

85+

At this score, automatic isolation begins.

PortGuardian Splunk dashboard
Server-side proof: the Splunk view shows incoming WARN and CRITICAL events from the clients on 192.168.1.50.